import matplotlib.pyplot as plt
import pandas as pd
from marine_qc import (
    do_aground_check,
    do_speed_check,
)
from data import get_buoy_data
How to use quality control checks with sequential reports from buoys
The marine_qc toolbox provides some quality control (QC) checks that work on sequential marine buoy reports. Creating some test dataset we can show how to use them on “real” data. There are three checks that are shown here:
a speed check that tests that speeds inferred from a sequence of reports are not implausible for a drifting buoy
a aground check that tests whether reports from a drifting buoy suggest it has run aground and stopped moving
For more information of all available QC checks on sequential buoy reports see the overview of QC functions for additional buoy reports.
The test dataset we provide is a pandas.DataFrame including sequential marine reports representing the track of one drifting buoy. The QC functions return a QC flag for each individual report. The flags are:
0: the check has passed1: the check has failed2: the check is untestable
data = get_buoy_data()
data
| buoy_id | date | lat | lon | sst | |
|---|---|---|---|---|---|
| 0 | buoy_1 | 2003-12-01 | 0.0 | 0.0 | 22.0 |
| 1 | buoy_1 | 2003-12-02 | 1.0 | 0.0 | 21.6 |
| 2 | buoy_1 | 2003-12-03 | 2.0 | 0.0 | 21.2 |
| 3 | buoy_1 | 2003-12-04 | 5.0 | 0.0 | 20.8 |
| 4 | buoy_1 | 2003-12-05 | 8.0 | 0.0 | 20.4 |
| 5 | buoy_1 | 2003-12-06 | 9.0 | 0.0 | 20.0 |
| 6 | buoy_1 | 2003-12-07 | 10.0 | 0.0 | 21.6 |
| 7 | buoy_1 | 2003-12-08 | 11.0 | 0.0 | 21.2 |
| 8 | buoy_1 | 2003-12-09 | 12.0 | 0.0 | 20.8 |
| 9 | buoy_1 | 2003-12-10 | 13.0 | 0.0 | 20.4 |
| 10 | buoy_1 | 2003-12-11 | 14.0 | 0.0 | 20.0 |
| 11 | buoy_1 | 2003-12-12 | 15.0 | 0.0 | 19.6 |
| 12 | buoy_1 | 2003-12-13 | 16.0 | 0.0 | 19.2 |
| 13 | buoy_1 | 2003-12-14 | 17.0 | 0.0 | 18.8 |
| 14 | buoy_1 | 2003-12-15 | 18.0 | 0.0 | 18.4 |
| 15 | buoy_1 | 2003-12-16 | 19.0 | 0.0 | 16.0 |
| 16 | buoy_1 | 2003-12-17 | 19.0 | 0.0 | 16.0 |
| 17 | buoy_1 | 2003-12-18 | 19.0 | 0.0 | 16.0 |
| 18 | buoy_1 | 2003-12-19 | 19.0 | 0.0 | 16.0 |
The drifting buoy data include four different parameters (lat, lon, date, and sst).
fig, axs = plt.subplots(1, 2, figsize=(13, 5))

axs[0].plot(data.lon, data.lat, marker="o", linestyle="-")
axs[0].set_title("Buoy drifter – latitude/longitude track")
axs[0].set_xlabel("Longitude (°)")
axs[0].set_ylabel("Latitude (°)")
axs[0].grid(True)

point_counts = {}
for lon, lat in zip(data.lon, data.lat, strict=False):
    point = (lon, lat)
    if point in point_counts:
        point_counts[point] += 1
    else:
        point_counts[point] = 1

# Add labels with occurrence counts
for point, count in point_counts.items():
    lon, lat = point
    axs[0].annotate(f"{count} time steps", (lon, lat), textcoords="offset points", xytext=(10, 0), ha="left")

axs[1].plot(data.sst, marker="o", linestyle="-")
axs[1].set_title("Buoy drifter – sea surface temperature")
axs[1].set_xlabel("Time")
axs[1].set_ylabel("Temperature (°C)")
axs[1].grid(True)

plt.tight_layout()
plt.show()
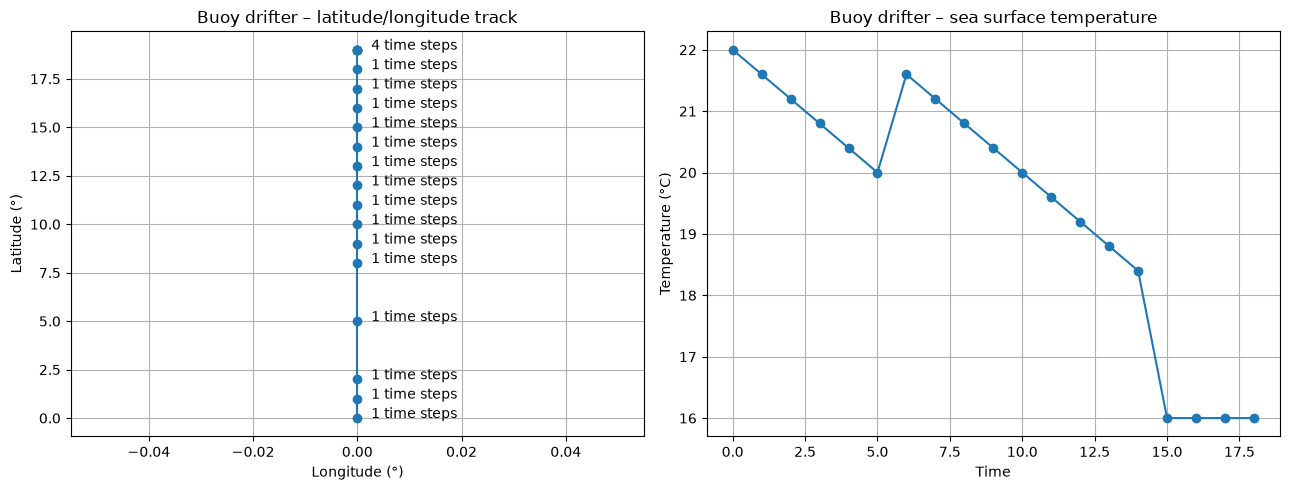
We see a buoy that is drifting northwards with a constant speed expect one time step. The last position is kept for four time steps. The buoy does not move anymore. The sea-surface temperature has an offset in the middle of the track.
Firstly, a speed check is performed. Beside lat, lon, and date, this check needs some extra parameters:
speed_limit: maximum allowable speed for an in situ drifting buoy in meters per second (
2.5)min_win_period: minimum period of time in days over which position is assessed for speed estimates (
1)max_win_period: maximum period of time in days over which position is assessed for speed estimates (
1)
The speed is calculated from lat, lon and date within a period of min_win_period and max_win_period. If the speed within this period is greater than speed_limit, the QC flags for the entire period are set to 1 (failed).
qc_speed = do_speed_check(
    lat=data.lat,
    lon=data.lon,
    date=data.date,
    speed_limit=2.5,
    min_win_period=1,
    max_win_period=1,
)
pd.DataFrame({"date": data.date, "lat": data.lat, "lon": data.lon, "qc_speed": qc_speed})
| date | lat | lon | qc_speed | |
|---|---|---|---|---|
| 0 | 2003-12-01 | 0.0 | 0.0 | 0 |
| 1 | 2003-12-02 | 1.0 | 0.0 | 0 |
| 2 | 2003-12-03 | 2.0 | 0.0 | 1 |
| 3 | 2003-12-04 | 5.0 | 0.0 | 1 |
| 4 | 2003-12-05 | 8.0 | 0.0 | 1 |
| 5 | 2003-12-06 | 9.0 | 0.0 | 0 |
| 6 | 2003-12-07 | 10.0 | 0.0 | 0 |
| 7 | 2003-12-08 | 11.0 | 0.0 | 0 |
| 8 | 2003-12-09 | 12.0 | 0.0 | 0 |
| 9 | 2003-12-10 | 13.0 | 0.0 | 0 |
| 10 | 2003-12-11 | 14.0 | 0.0 | 0 |
| 11 | 2003-12-12 | 15.0 | 0.0 | 0 |
| 12 | 2003-12-13 | 16.0 | 0.0 | 0 |
| 13 | 2003-12-14 | 17.0 | 0.0 | 0 |
| 14 | 2003-12-15 | 18.0 | 0.0 | 0 |
| 15 | 2003-12-16 | 19.0 | 0.0 | 0 |
| 16 | 2003-12-17 | 19.0 | 0.0 | 0 |
| 17 | 2003-12-18 | 19.0 | 0.0 | 0 |
| 18 | 2003-12-19 | 19.0 | 0.0 | 0 |
As expected the speed check fails for three time steps where the speed increases.
Next, a aground check is performed. Beside lat, lon, and date, this check needs some extra parameters:
smooth_win: length of window (odd number) in datapoints used for smoothing lon/lat (
3)min_win_period: minimum period of time in days over which position is assessed for speed estimates (
1)max_win_period: maximum period of time in days over which position is assessed for speed estimates (
1)
qc_aground = do_aground_check(
    lat=data.lat,
    lon=data.lon,
    date=data.date,
    smooth_win=3,
    min_win_period=1,
    max_win_period=1,
)
pd.DataFrame({"date": data.date, "lat": data.lat, "lon": data.lon, "qc_aground": qc_aground})
| date | lat | lon | qc_aground | |
|---|---|---|---|---|
| 0 | 2003-12-01 | 0.0 | 0.0 | 0 |
| 1 | 2003-12-02 | 1.0 | 0.0 | 0 |
| 2 | 2003-12-03 | 2.0 | 0.0 | 0 |
| 3 | 2003-12-04 | 5.0 | 0.0 | 0 |
| 4 | 2003-12-05 | 8.0 | 0.0 | 0 |
| 5 | 2003-12-06 | 9.0 | 0.0 | 0 |
| 6 | 2003-12-07 | 10.0 | 0.0 | 0 |
| 7 | 2003-12-08 | 11.0 | 0.0 | 0 |
| 8 | 2003-12-09 | 12.0 | 0.0 | 0 |
| 9 | 2003-12-10 | 13.0 | 0.0 | 0 |
| 10 | 2003-12-11 | 14.0 | 0.0 | 0 |
| 11 | 2003-12-12 | 15.0 | 0.0 | 0 |
| 12 | 2003-12-13 | 16.0 | 0.0 | 0 |
| 13 | 2003-12-14 | 17.0 | 0.0 | 0 |
| 14 | 2003-12-15 | 18.0 | 0.0 | 0 |
| 15 | 2003-12-16 | 19.0 | 0.0 | 1 |
| 16 | 2003-12-17 | 19.0 | 0.0 | 1 |
| 17 | 2003-12-18 | 19.0 | 0.0 | 1 |
| 18 | 2003-12-19 | 19.0 | 0.0 | 1 |
For the last four time steps the buoy is not moving anymore. Hence, the aground check fails as expected.