import pandas as pd
from marine_qc import (
    combine_qc_results,
    do_climatology_check,
    do_datetime_check,
    do_hard_limit_check,
    do_maritime_check,
    do_multiple_individual_check,
    do_position_check,
    do_valid_value_check,
    do_wind_consistency_check,
    plot_latitude_longitude,
)
from marine_qc.helpers.external_clim import get_climatological_value
from data import get_climatology_data, get_individual_data
How to use quality control checks with individual reports
The marine_qc toolbox provides some quality control (QC) checks that work on individual marine reports. Creating some test dataset we can show how to use them on “real” data. There are several checks that are shown here:
a position check that tests whether the latitude-longitude position of the report is valid
a datetime check that tests whether both the date and the time of the report is valid
a valid-value check that tests whether an observational value is present
a hard-limit check that tests whether an observational value is within a specified range
a wind-consistency check that tests whether wind speed and wind direction are consistent
a maritime check that tests whether latitude-longitude is on sea whereby an external land-sea mask is needed
a climatology check that tests whether an observational value is within an acceptable range around the mean of an external climatology
Finally, we run all these QC checks within a single function and combine the results of each QC check into a single QC flag.
For more information of all available QC checks on individual reports see the overview of QC functions for individual reports.
The test dataset we provide is a pandas.DataFrame including several individual marine reports. The QC functions return a QC flag for each individual report. The flags are:
0: the check has passed1: the check has failed2: the check is untestable
data = get_individual_data()
data
| location | lat | lon | date | sea_surface_temperature | wind_speed | wind_direction | |
|---|---|---|---|---|---|---|---|
| 0 | Mediterranean Sea | 36.0 | 18.0 | 2025-06-01 06:00:00 | 22.8 | 5.2 | 135 |
| 1 | North Sea | 54.5 | 3.0 | 2025-06-01 12:00:00 | 13.6 | 0.0 | 270 |
| 2 | South Pacific Ocean | -140.0 | -15.0 | 2025-06-01 18:00:00 | 27.4 | 7.8 | 90 |
| 3 | Paris, France | 48.9 | 2.3 | 2025-06-02 14:30:00 | NaN | 3.5 | 45 |
| 4 | Tokyo, Japan | 35.7 | 139.7 | 2025-06-03 08:45:00 | NaN | 6.2 | 225 |
| 5 | Sydney, Australia | -33.9 | 151.2 | 2025-06-03 20:10:00 | NaN | 8.1 | 160 |
| 6 | Gulf of Mexico | 25.0 | -90.0 | NaT | 29.1 | 10.5 | 315 |
| 7 | Equatorial Atlantic | 0.0 | -30.0 | 2025-06-04 16:20:00 | 28.3 | 5.9 | 110 |
| 8 | Norwegian Sea | 60.0 | 5.0 | 2025-06-05 07:50:00 | 8.5 | 14.3 | 290 |
We have nine different marine reports that include six different parameters (lat, lon, date, sea_surface_temperature, wind_speed and wind_direction).
Checks that need no external data
We start with the position check. The function needs latitude and longitude values as input.
qc_pos = do_position_check(
    lat=data.lat,
    lon=data.lon,
)
pd.DataFrame({"location": data.location, "lat": data.lat, "lon": data.lon, "qc_pos": qc_pos})
| location | lat | lon | qc_pos | |
|---|---|---|---|---|
| 0 | Mediterranean Sea | 36.0 | 18.0 | 0 |
| 1 | North Sea | 54.5 | 3.0 | 0 |
| 2 | South Pacific Ocean | -140.0 | -15.0 | 1 |
| 3 | Paris, France | 48.9 | 2.3 | 0 |
| 4 | Tokyo, Japan | 35.7 | 139.7 | 0 |
| 5 | Sydney, Australia | -33.9 | 151.2 | 0 |
| 6 | Gulf of Mexico | 25.0 | -90.0 | 0 |
| 7 | Equatorial Atlantic | 0.0 | -30.0 | 0 |
| 8 | Norwegian Sea | 60.0 | 5.0 | 0 |
All checks have passed except the check for the South Pacific Ocean. It seems that latitude and longitude values are swapped. These are the expected results.
The next check is the datetime check which only needs date values as input.
qc_datetime = do_datetime_check(
    data.date,
)
pd.DataFrame({"location": data.location, "date": data.date, "qc_datetime": qc_datetime})
| location | date | qc_datetime | |
|---|---|---|---|
| 0 | Mediterranean Sea | 2025-06-01 06:00:00 | 0 |
| 1 | North Sea | 2025-06-01 12:00:00 | 0 |
| 2 | South Pacific Ocean | 2025-06-01 18:00:00 | 0 |
| 3 | Paris, France | 2025-06-02 14:30:00 | 0 |
| 4 | Tokyo, Japan | 2025-06-03 08:45:00 | 0 |
| 5 | Sydney, Australia | 2025-06-03 20:10:00 | 0 |
| 6 | Gulf of Mexico | NaT | 2 |
| 7 | Equatorial Atlantic | 2025-06-04 16:20:00 | 0 |
| 8 | Norwegian Sea | 2025-06-05 07:50:00 | 0 |
As expected all checks have passed except the check for the Gulf of Mexico. We get a 2 that stands for untestable since the datetime is not wrong but not available.
In the next few checks we focus on sea_surface_temperature. First of all, we want to check if the values are valid.
qc_valid = do_valid_value_check(
    data.sea_surface_temperature,
)
pd.DataFrame({"location": data.location, "sea_surface_temperature": data.sea_surface_temperature, "qc_valid": qc_valid})
| location | sea_surface_temperature | qc_valid | |
|---|---|---|---|
| 0 | Mediterranean Sea | 22.8 | 0 |
| 1 | North Sea | 13.6 | 0 |
| 2 | South Pacific Ocean | 27.4 | 0 |
| 3 | Paris, France | NaN | 1 |
| 4 | Tokyo, Japan | NaN | 1 |
| 5 | Sydney, Australia | NaN | 1 |
| 6 | Gulf of Mexico | 29.1 | 0 |
| 7 | Equatorial Atlantic | 28.3 | 0 |
| 8 | Norwegian Sea | 8.5 | 0 |
Since no values for Paris, Tokyo and Sydney are provided, the checks fail for these reports as expected.
Next, we check whether the values are within a range between 10 and 30 °C.
qc_hard = do_hard_limit_check(
    data.sea_surface_temperature,
    limits=(10, 30),
)
pd.DataFrame({"location": data.location, "sea_surface_temperature": data.sea_surface_temperature, "qc_hard": qc_hard})
| location | sea_surface_temperature | qc_hard | |
|---|---|---|---|
| 0 | Mediterranean Sea | 22.8 | 0 |
| 1 | North Sea | 13.6 | 0 |
| 2 | South Pacific Ocean | 27.4 | 0 |
| 3 | Paris, France | NaN | 2 |
| 4 | Tokyo, Japan | NaN | 2 |
| 5 | Sydney, Australia | NaN | 2 |
| 6 | Gulf of Mexico | 29.1 | 0 |
| 7 | Equatorial Atlantic | 28.3 | 0 |
| 8 | Norwegian Sea | 8.5 | 1 |
As expected, the check fails for the Norwegian Sea since the value is under 10 °C (8.5 °C). Interstingly, we get three 2s (untestable) for locations where no values are provided. The aim of the hard-limit test is not to test whether a value is valid but to test whether a value is within a specified range. Therefore, we decided to return 2s instead of 1s (failed).
The last check that only need inputs from the dataset is the wind-consistency check. This is a so-called cross check that test whether two observsational values are consistent. In this check, wind_speed and wind_direction are consistent if zero wind_speed corresponds to no particular wind_direction and wind_speed above a threshold corresponds to a particular wind_direction.
qc_wind = do_wind_consistency_check(
    wind_speed=data.wind_speed,
    wind_direction=data.wind_direction,
)
pd.DataFrame({"location": data.location, "wind_speed": data.wind_speed, "wind_direction": data.wind_direction, "qc_wind": qc_wind})
| location | wind_speed | wind_direction | qc_wind | |
|---|---|---|---|---|
| 0 | Mediterranean Sea | 5.2 | 135 | 0 |
| 1 | North Sea | 0.0 | 270 | 1 |
| 2 | South Pacific Ocean | 7.8 | 90 | 0 |
| 3 | Paris, France | 3.5 | 45 | 0 |
| 4 | Tokyo, Japan | 6.2 | 225 | 0 |
| 5 | Sydney, Australia | 8.1 | 160 | 0 |
| 6 | Gulf of Mexico | 10.5 | 315 | 0 |
| 7 | Equatorial Atlantic | 5.9 | 110 | 0 |
| 8 | Norwegian Sea | 14.3 | 290 | 0 |
All checks have passed except the check for the Norwegian Sea. Here, zero wind_speed correspond to a particular wind_direction (270°).
Checks that do need external data
Now, we focus on QC checks that need external data in addition to the individual reports. Firtly, we import some external data. This is a xarray.Dataset containing CF-compliant data:
a land-sea mask where
1denotes a land point and0denotes a sea point (land_sea_mask)a simple, latitudinally and longitudinally dependent sea-surface temperature field (
sst)a sea-surface temperature standard deviation of grid cell minus neighbourhood mean (
sst_stde1)a sea-surface temperature standard deviation of point observation minus grid cell mean (
sst_stde2)a sea-surface temperature standard deviation of neighbourhood mean uncertainty (
sst_stde3)
climatology_data = get_climatology_data()
climatology_data
<xarray.Dataset> Size: 2MB
Dimensions:        (time: 1, latitude: 180, longitude: 360)
Coordinates:
  * time           (time) datetime64[us] 8B 2026-07-01T12:00:00
  * latitude       (latitude) int64 1kB -90 -89 -88 -87 -86 ... 85 86 87 88 89
  * longitude      (longitude) int64 3kB -180 -179 -178 -177 ... 176 177 178 179
Data variables:
    land_sea_mask  (time, latitude, longitude) int8 65kB 0 1 1 1 1 ... 0 0 0 0 0
    sst            (time, latitude, longitude) float64 518kB -1.225e-16 ... 0...
    sst_stdev1     (time, latitude, longitude) float64 518kB 0.475 ... 0.4754
    sst_stdev2     (time, latitude, longitude) float64 518kB 0.84 nan ... 0.8407
    sst_stdev3     (time, latitude, longitude) float64 518kB 0.235 ... 0.2352
crs int64 8B 0Firstly, we check whether the positions of the marine reports are on sea using the external land-sea mask.
climatology_data.land_sea_mask.plot()
<matplotlib.collections.QuadMesh at 0x7aa17bf48590>
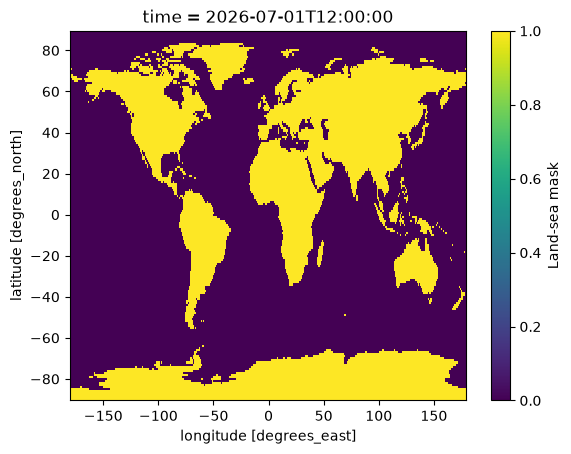
We do not need to extract the latitude-longitude points amnually from the land-sea mask. This is done internally in the maritime check. We simply can pass the entire land-sea mask as a xarray.DataArray to the function.
qc_sea = do_maritime_check(
    lat=data.lat,
    lon=data.lon,
    sea_land_mask=climatology_data.land_sea_mask,
    sea_flag=0,
)
pd.DataFrame({"location": data.location, "lat": data.lat, "lon": data.lon, "qc_sea": qc_sea})
| location | lat | lon | qc_sea | |
|---|---|---|---|---|
| 0 | Mediterranean Sea | 36.0 | 18.0 | 0 |
| 1 | North Sea | 54.5 | 3.0 | 0 |
| 2 | South Pacific Ocean | -140.0 | -15.0 | 1 |
| 3 | Paris, France | 48.9 | 2.3 | 1 |
| 4 | Tokyo, Japan | 35.7 | 139.7 | 1 |
| 5 | Sydney, Australia | -33.9 | 151.2 | 1 |
| 6 | Gulf of Mexico | 25.0 | -90.0 | 0 |
| 7 | Equatorial Atlantic | 0.0 | -30.0 | 0 |
| 8 | Norwegian Sea | 60.0 | 5.0 | 0 |
As expected all checks have passed except for the land points (Paris, Tokyo and Sydney).
Finally, we check sea_surface_temeprature against the sea-surface climatology. The check should pass if the value from the report and the climatological value do not differ more than 5K. As in the check above, we can provide the external data as xarray.DataArray.
climatology_data.sst.plot()
<matplotlib.collections.QuadMesh at 0x7aa17bdf9450>
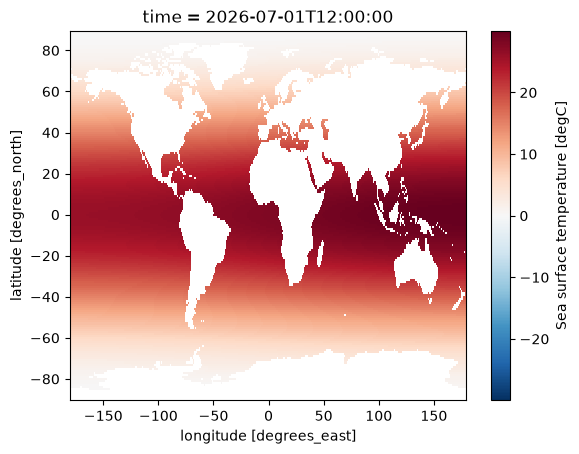
We want to extract and show the climatological values that correspond to the latitude-longitude positions in the marine reports. Therefore, we can use the use the helper function get_climatological_value from marine_qc.helpers.external_clim.
clim_sst = get_climatological_value(climatology_data.sst, lat=data.lat, lon=data.lon)
qc_clim = do_climatology_check(
    value=data.sea_surface_temperature,
    climatology=climatology_data.sst,
    maximum_anomaly=5.0,
    lat=data.lat,
    lon=data.lon,
)
pd.DataFrame(
    {
        "location": data.location,
        "lat": data.lat,
        "lon": data.lon,
        "sea_surface_temperature": data.sea_surface_temperature,
        "climatology": clim_sst,
        "qc_clim": qc_clim,
    }
)
| location | lat | lon | sea_surface_temperature | climatology | qc_clim | |
|---|---|---|---|---|---|---|
| 0 | Mediterranean Sea | 36.0 | 18.0 | 22.8 | 18.579354 | 0 |
| 1 | North Sea | 54.5 | 3.0 | 13.6 | 9.704535 | 0 |
| 2 | South Pacific Ocean | -140.0 | -15.0 | 27.4 | NaN | 2 |
| 3 | Paris, France | 48.9 | 2.3 | NaN | NaN | 2 |
| 4 | Tokyo, Japan | 35.7 | 139.7 | NaN | NaN | 2 |
| 5 | Sydney, Australia | -33.9 | 151.2 | NaN | NaN | 2 |
| 6 | Gulf of Mexico | 25.0 | -90.0 | 29.1 | 21.717314 | 1 |
| 7 | Equatorial Atlantic | 0.0 | -30.0 | 28.3 | 27.482362 | 0 |
| 8 | Norwegian Sea | 60.0 | 5.0 | 8.5 | 7.043619 | 0 |
As for the hard-limit test, we get 2s (untestable) for reports without sea-surface temperatures. The check for the Gulf of Mexico fails the the temperature difference is more than 5K. All other checks have passed as expected.
Run all checks within one function
We can run multiple QC checks within one function (do_multiple_individual_check). Therefore, we need a pandas.DataFrame and a nested QC dictionary. This is the structure of the dictionary:
arbitrary user-specified name for the checks
“func”: name of the QC function as
str(mandatory)“names”: dictionary containing parameter names of the QC function and their corresponding columns in the
pandas.DataFrame(mandatory)“arguments”: dictionary containing any key-word arguments passed to the QC function (optionally)
…
We define the QC dictionary according to the QC checks above.
qc_dict = {
    "positional_check": {
        "func": "do_position_check",
        "names": {
            "lat": "lat",
            "lon": "lon",
        },
    },
    "datetime_check": {
        "func": "do_datetime_check",
        "names": {"date": "date"},
    },
    "hard_limit_check": {"func": "do_hard_limit_check", "names": {"value": "sea_surface_temperature"}, "arguments": {"limits": (10, 29)}},
    "maritime_check": {
        "func": "do_maritime_check",
        "names": {
            "lat": "lat",
            "lon": "lon",
        },
        "arguments": {
            "sea_land_mask": climatology_data.land_sea_mask,
            "sea_flag": 0,
        },
    },
    "climatology_check": {
        "func": "do_climatology_check",
        "names": {"value": "sea_surface_temperature"},
        "arguments": {
            "climatology": climatology_data.sst,
            "maximum_anomaly": 5.0,
            "lat": data.lat,
            "lon": data.lon,
        },
    },
    "wind_consistency_check": {
        "func": "do_wind_consistency_check",
        "names": {"wind_speed": "wind_speed", "wind_direction": "wind_direction"},
    },
}
Now, run all QC checks calling one function. We set return_method to “failed” which means that all requested QC check are run until the first check fails. The other QC checks are flagged as unstested (3).
qc_multi = do_multiple_individual_check(
    data,
    qc_dict,
    return_method="failed",
)
qc_multi
| positional_check | datetime_check | hard_limit_check | maritime_check | climatology_check | wind_consistency_check | |
|---|---|---|---|---|---|---|
| 0 | 0 | 0 | 0 | 0 | 0 | 0 |
| 1 | 0 | 0 | 0 | 0 | 0 | 1 |
| 2 | 1 | 3 | 3 | 3 | 3 | 3 |
| 3 | 0 | 0 | 2 | 1 | 3 | 3 |
| 4 | 0 | 0 | 2 | 1 | 3 | 3 |
| 5 | 0 | 0 | 2 | 1 | 3 | 3 |
| 6 | 0 | 2 | 1 | 3 | 3 | 3 |
| 7 | 0 | 0 | 0 | 0 | 0 | 0 |
| 8 | 0 | 0 | 1 | 3 | 3 | 3 |
Now, we combine the results into one final QC flag. The QC flag values are prioritized in this order: [1, 0, 3, 2].
qc_flag = combine_qc_results(qc_multi)
pd.DataFrame({**data, "qc_flag": qc_flag})
| location | lat | lon | date | sea_surface_temperature | wind_speed | wind_direction | qc_flag | |
|---|---|---|---|---|---|---|---|---|
| 0 | Mediterranean Sea | 36.0 | 18.0 | 2025-06-01 06:00:00 | 22.8 | 5.2 | 135 | 0 |
| 1 | North Sea | 54.5 | 3.0 | 2025-06-01 12:00:00 | 13.6 | 0.0 | 270 | 1 |
| 2 | South Pacific Ocean | -140.0 | -15.0 | 2025-06-01 18:00:00 | 27.4 | 7.8 | 90 | 1 |
| 3 | Paris, France | 48.9 | 2.3 | 2025-06-02 14:30:00 | NaN | 3.5 | 45 | 1 |
| 4 | Tokyo, Japan | 35.7 | 139.7 | 2025-06-03 08:45:00 | NaN | 6.2 | 225 | 1 |
| 5 | Sydney, Australia | -33.9 | 151.2 | 2025-06-03 20:10:00 | NaN | 8.1 | 160 | 1 |
| 6 | Gulf of Mexico | 25.0 | -90.0 | NaT | 29.1 | 10.5 | 315 | 1 |
| 7 | Equatorial Atlantic | 0.0 | -30.0 | 2025-06-04 16:20:00 | 28.3 | 5.9 | 110 | 0 |
| 8 | Norwegian Sea | 60.0 | 5.0 | 2025-06-05 07:50:00 | 8.5 | 14.3 | 290 | 1 |
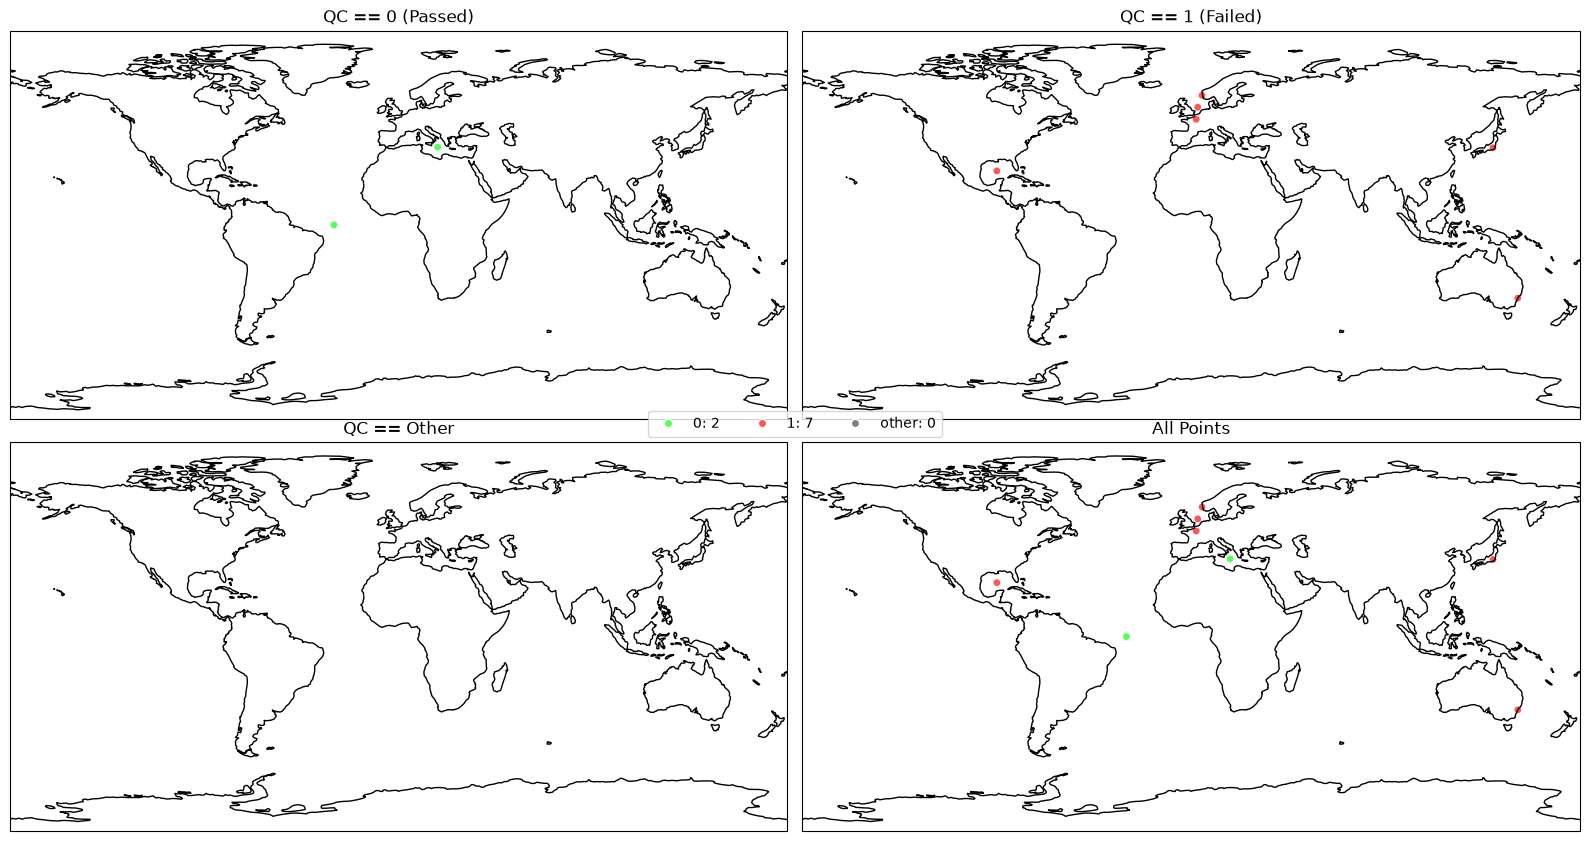
This is our final QC results. Let’s make some plots.
plot = plot_latitude_longitude(data.lat, data.lon, qc_flag, marker_size=15, add_coastlines=True)
/home/docs/checkouts/readthedocs.org/user_builds/marine-qc/conda/latest/lib/python3.14/site-packages/cartopy/io/__init__.py:242: DownloadWarning: Downloading: https://naturalearth.s3.amazonaws.com/110m_physical/ne_110m_coastline.zip
  warnings.warn(f'Downloading: {url}', DownloadWarning)